About dashboard widgets
What are Autotask widgets?
Autotask widgets are graphical interface elements that visualize and summarize information about the data in Autotask. The gauges and charts (such as column and pie charts) we use to visualize the data are familiar to users from spreadsheet and reporting applications.
Similar to buttons on a user interface, users can interact with graphical elements. Clicking on, or drilling into, a graphical element or a component (such as a single bar or a slice of the pie) opens a table table that contains the underlying data. You can then click a row or use the right-click menu to open or edit an individual record. When you drill in to ticket widgets, you also have the option to view them in a board format. Refer to About Boards.
NOTE You can display up to 24 data widgets on a dashboard tab. Refer to Introduction to the Autotask dashboard.
How are widgets tied to entities?
An entity is an object in Autotask for which information is collected and stored in your Autotask instance, for example, a ticket, opportunity, or project. Every widget is associated with one specific entity and visualizes information about that entity. The widget can only access data from the associated entity.
EXAMPLE For example, if you want your widget to display sales-related information, select the Opportunity entity. If you want to view ticket-related information, select the Ticket entity.
Autotask has created widgets for all entities that can currently be associated with them. These widgets are listed and described in The Dashboard Widgets Library topic under the Widget descriptions by entity heading.
Special case: HTML widgets
HTML widgets are the exception. They are text-based and are not tied to any entity. They allow you to place custom content inside of a dashboard widget.
To create an HTML widget, you select Miscellaneous from the Entity drop-down menu. For more detailed information on creating HTML widgets, refer to Remaining settings for HTML widgets.
Widget security
Refer to Widget security.
Widget types and visualization types
When you add a new widget, you must select a widget type. The widget type determines which visualization types you can choose from. The visualization type determines how the data is displayed.
EXAMPLE For example, if your widget type is a chart, you can select a pie chart or bar chart visualization type; if your widget is a gauge type, you can select a meter or single number visualization type.
The following tables list the visualization types available for each widget type.
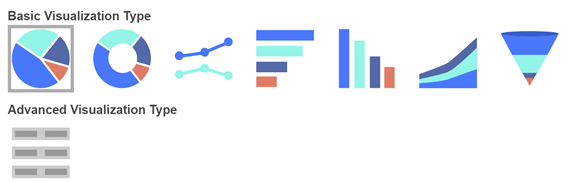
Select Chart if you want a graph style visualization. The following visualization types are available:
| Visualization Type | Description | |
|---|---|---|

|
Pie | A circle divided into wedge-shaped sections. Each section represents a static value and that value's proportion of the total represented by the chart. Pie charts are often used to display percentages. They cannot show changes in data over time. They are most effective when comparing a limited number of values; too many wedges make it difficult to compare values. For example, you may use a pie chart to show the how the count of open opportunities is distributed between members of the sales team. |

|
Doughnut | Similar to a pie chart but with an open center. Most doughnut type widgets in custom dashboards display a numeric total in the center of the doughnut. |

|
Line | Shows a series of data points across a range of values, most frequently a range of time. The values are connected by a line. Line charts are most useful to monitor trends. For example, you may use a line chart to monitor how many tickets are created each day over a specific time period. |

|
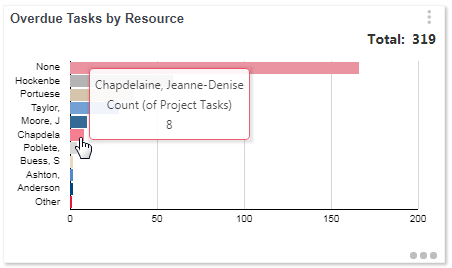
Bar | A series of horizontal shapes, usually rectangles (bars), that represent the different values in a data set. A good choice when comparing values that are not necessarily related to time. For example, you may use a bar chart to display the count of open tickets grouped by resource. Each bar represents a resource, and the size of the bar represents the number of open tickets assigned to that resource. Bars can be grouped within the chart to represent sub-sets, for example, to see the statuses of open tickets assigned to each resource. Then, for each resource, the chart would show a group of bars, with each bar showing the ticket count for one status. |

|
Column | A series of vertical shapes, usually rectangles (columns), that represent the different values in a data set. A vertical bar chart. See Bar, above. |

|
Stacked Bar or Stacked Column |
Advanced Visualization Type: A bar or column chart where the bar or column is divided into segments that each represent a subset of the whole. For example, a column might display a total count of tickets assigned to one resource, with segments representing the number of tickets in different statuses. |

|
Grouped Bar or Column | Advanced Visualization Type: A bar or column chart where columns are organized into secondary groupings. For example, a group may represent one primary resource, with each column representing the different statuses of tickets assigned to that resource. |

|
Stacked Bar 100% or Stacked Column 100% |
Advanced Visualization Type: A bar or column chart where the bar or column is divided into segments that each represent a subset of the whole and the bars or columns are all of equal length, representing 100% of the category values. Each segment then represents a subset as the percentage of the total value. For example, you may use a stacked column chart to compare what percentage of opportunities expected to close each week over the next six weeks are owned by different sales associates. Each of six columns represents 100% of opportunities expected to close in the specified week. Each segment represents the percent of those opportunities owned by one resource. |

|
Area | Similar to a line chart, with a series of values connected by a line that is displayed across a range. Unlike line charts, the area under the line is filled in with color. Refer to line, above. |

|
Stacked Area | An area chart with multiple data lines where the spaces between the lines are filled with different colors. |

|
Table | Advanced Visualization Type: Data is presented in a list style with multiple columns. Each line shows a group and the count, sum, or average. When Secondary Grouping is specified, each column after the first column displays the available options from the secondary grouping. For example, if the secondary grouping is Status, each column after the first column displays a status. |

|
Funnel | A distinctively shaped chart where each segment is a percentage of the whole (similar to a stacked column), with segments representing a downward progression. Most frequently used to represent the progression of sales leads to closed deals. |
Select this widget type if you want a graph style visualization that counts the number of tickets based on tag or tag group combinations, UDF values, or work list owners.
IMPORTANT A single ticket can appear in more than one chart grouping. A ticket will be counted every time it is associated with a particular tag or UDF value, and for every user whose work list it is on, in your chart criteria. For this reason, the Total field is not available for these charts.
| Visualization Type | Description | |
|---|---|---|
| Selected Chart type visualizations |
|
This visualization type presents a simplified version of a typical chart, providing only options that make sense for counting tickets with a one-to-many relationship. You can count tickets, and group and filter by tags, tag groups, UDF values, and work list owners. |
Select this widget type if you want a graph-style visualization that compares two metrics over time. The visualization type choices are line, bar, column, and table.
| Visualization Type | Description | |
|---|---|---|
| Selected Chart type visualizations | 
|
For comparison charts, you can select a line, bar, column, or table chart visualization. Refer to the descriptions for Chart type visualizations. The visualization will display two sets of data, for example, two lines, over a time range. There are slight differences in the comparison chart Data settings: Also report on... is required, and the Report on and Group by menu options are different from basic charts. When you select to show totals, or to show legend and totals, the chart will display the legend with a total next to each data type in the legend. No overall total will be displayed. |
Select Gauge if you want a meter-style visualization.
TIP You can include up to six gauges (sub-widgets) in one widget. Gauges are stacked and arranged automatically to fit the column width of the widget.
The following visualization types are available:
| Visualization Type | Description | |
|---|---|---|

|
Needle | A half circle divided into segments, with each segment representing an increasing or decreasing value range. You specify how many segments on the widget settings. Depending on your data, the total of the half circle segments generally represents 100% of a goal or limit. The segments represent a level of success in meeting the goals or staying within the limits. The needle represents the actual value of the specified data point. Its position indicates where that value falls within the levels of success. The actual percent of the data point appears below the needle. . For example, you might use a needle if you want to see what level of success your team has achieved in meeting their goal for tickets closed in the current week, or to monitor survey ratings. |

|
Doughnut | A circular format with an open center, this gauge also uses segments to represent a range of values. The circle indicates the total value of the segments, with a different color arc indicating which segment contained the calculated data point. The size of the arc indicates the percentage of the total represented by the specified data point. The actual numeric value of the specified data point is displayed in the center of the circle in the same color as the arc. For example, with the red, yellow, green color range, if the arc is yellow, the specified data point falls within the middle segment. |

|
Number | A simple numeric display that indicates the actual number that the data point represents. The color of the number indicates where the data point falls in the specified range. For example, if the widget displays the number of critical tickets closed as 75, and your range segments are 0-10 (red), 11- 50 (yellow), and 51-100 (green), the number will be displayed in green to indicate that you are within the good range for closing critical tickets. |
Select Grid if you want a list-style visualization with columns, similar to an Autotask table.
| Visualization Type | Description | |
|---|---|---|

|
Grid | Currently there are no options to select. All Grid widgets are a multi-column table. You specify a primary column, multiple additional columns (based on the fields available with the selected entity type), and the order in which they appear from left to right. The primary (first) column can display multiple fields in one cell, for example, a ticket number, ticket title, and organization name. Grid widgets have the option to include a context menu column. Grid widgets provide many of the features found in Autotask search result tables, including column sort, context menu for individual items (optional), and color coding of some text. Refer to Working with widgets, drill-in grids and boards. |
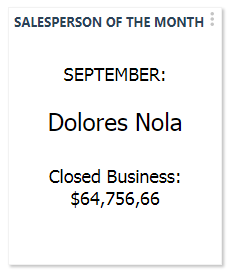
Select [Miscellaneous] from the Entity menu and HTML as your widget type to create a widget that uses HTML to display text and images. There are no visualization types for this widget type.
| Widget Type | Visualization Type | Description |
|---|---|---|
| HTML |
||

|
HTML |
The HTML widget type does not have visualization types. It does not specify an entity or provide access to your Autotask data. It provides a blank canvas where you can use the Autotask HTML editor to create an HTML-based visual display. The HTML editor for widgets does not include a variable selector. Refer to The HTML editor. HTML widgets do not provide filtering options. Size and layout options conform to the basic options available to other widgets. Your instance of Autotask may not allow HTML widgets on shared dashboards. This is controlled by a site-wide system setting. Refer to Allow HTML widgets on shared dashboard tabs. |
| Name | Description |
|---|---|
| Axis | The horizontal or vertical line that marks the dimensions of most chart types. The two axes display the scale that indicates the values of the data. Typically, the horizontal axis is referred to as the X axis and the vertical axis is the Y axis. Most often, the data categories (what you are reporting on) appear on the x axis, and their values appear on the Y axis. An exception is a bar chart that displays horizontal bars. |
| Axis Labels | Labels along the horizontal and vertical axes that describe the categories or units of measure represented on the axes. Not available for pie or doughnut charts. |
| Data point | A point on a chart or graph that represents a defined value in the data set. For example, in a line chart, data points are plotted on the chart and then connected by a line; a pie chart wedge defines a data point for one category in the chart. |
| Entity | An object in Autotask for which information is collected and stored in your Autotask instance. For widgets, the entity determines what data the widget can access. For example, in order to access data about sales revenue, you must associated the widget with the Opportunity entity. |
| Filter | A widget setting used to specify conditions that narrow or focus the data to display in a widget. For example, if you have a widget set up to display a count of open tickets, and you want to see only open tickets assigned to you, you would use a filter to include only tickets where you are the primary resource. |
| Legend | A list that maps colors from the chart to their associated data category. |
| Name/Title | The name of the widget. This name appears on the widget and should provide insight as to what the widget displays. |
| Range | A series of values defined by the smallest and largest values. For example, if a widget displays a range of 1 through 5, any data that is >=1 and <= 5 will be displayed. |
| Range Break Points | When a range is divided into segments, a break point defines the value that marks the end of a segment. |
| Scale | The units of measure for the values displayed on the widget. |
| Segment | A section of a chart or gauge that represents a specific value. For example, the wedge in a pie chart is a segment that represents a percentage value. |
| Trendline | A line on a chart or graph that connects key points to show a trend, usually over time. |
| Visualization Type | Determines the appearance of the widget. Different widget types have different visualization types. Refer to the Visualization Type Quick Reference, above. |
| Widget Type | Chart, gauge, grid, chart (compare 2 metrics over time), and HTML. Refer to the descriptions above. |


