The Gantt chart (timeline view)
PERMISSIONS Permission to view projects. Refer to Project security settings.
NAVIGATION Left Navigation Menu > Projects > Search > Projects > click Search > context menu > View Project > Schedule > Gantt Chart Icon
The Gantt chart displays phases, tasks, and issues as bars on a visual timeline. The bars are color coded so you can see their relationship over time. The timeline allows you to view the chronological relationship of schedule items, and to quickly assess where the project stands in relationship to end dates. To open the page, use the path(s) in the Security and navigation section above.
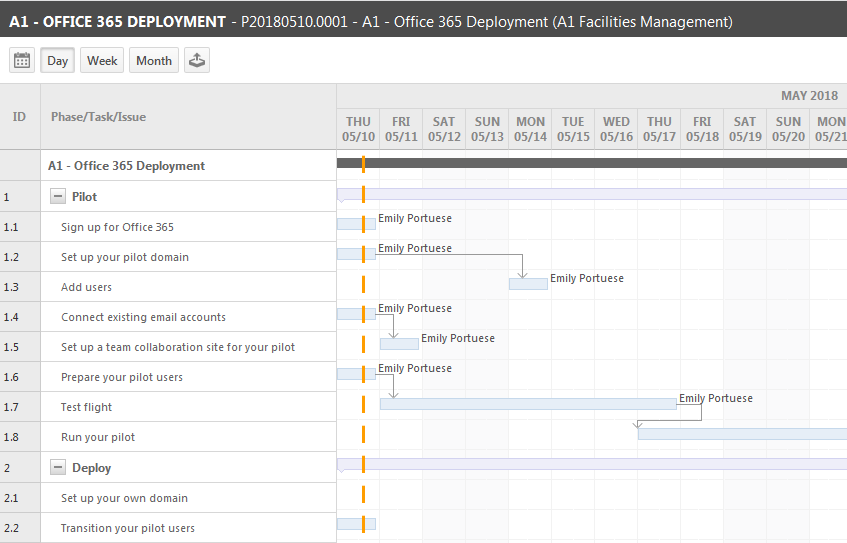
The Gantt chart opens to the Day view. Each column represents one day. Click Week or Month to change the view.
The date or date range for each column displays at the top of the chart. If your project view extends beyond the visible space, use the scroll bar at the bottom to view additional columns.
TIP The First Day of Week is a location-level setting. An administrator can select Monday as the First Day of the Week for your location. Refer to Internal locations.
The first column lists the schedule ID numbers of each phase, task, or issue. The next column lists the phase, task, and issue names.
The following table describes the Gantt timeline features and additional tools.
| Feature | Description |
|---|---|
| ToolbarStarting from the left | |
| Calendar icon | Click the calendar to return to the schedule Outline view. |
| Day/Week/Month | Click one to select the time span represented by each column in the timeline. |
| Export icon | Click this icon to export the Gantt Chart to a Microsoft Excel spreadsheet. Export from all browsers that meet system requirements is supported. The % Complete column on the spreadsheet is calculated as follows:
|
| Chart | |
| ID Column | Displays the phase, task, or issue ID number from the schedule List view. |
| Phase/Task/Issue | The phase, task, or issue name. The first row in the column is the project name. To collapse or expand the phases in this view, click the box with + or - . |
| Date Line | Displays the date or date range for each column. For the Day or Week display, the Month and Year appear above the column dates. When business days only or weekends are selected as project settings, the columns for those days appear on the date line, but they do not display a table within the column. Bars do not show in those columns. Refer to Schedule settings. |
| Orange Vertical Dashes | Today. |
| Purple bars | Phases. Darker purple shows percent complete, that is, Actual Hours/Estimated Hours * 100. |
| Blue bars | Tasks. Darker blue shows percent complete, that is, Actual Hours/Estimated Hours * 100. |
| Yellow bars | Complications. Darker yellow shows percent complete, that is, Actual Hours/Estimated Hours * 100. |
| Red bars | Overdue phases, task, or issues display in red. Darker shade indicates percent complete, that is, Actual Hours/Estimated Hours * 100. |
| Arrow lines | A thin line with an arrow head on one end represents the dependency between predecessor and successor items. |
| Resource name (+#) | The name of the Primary resource assigned to each task and issue appears at the right end point of a task or issue bar. If secondary resources are assigned, the number of resources is indicated with a plus sign in parentheses (+#). |
| Tooltips | Hover over any bar to display the name of the associated phase, task, or issue. The display also includes the status, date range, and location for the item and the duration. |


